Classifying the information
This strategy consists of organising the information selected from a text into categories and sub-categories, according to a system and order of classification that will facilitate understanding and use (Ruph, 2010). This effort of thinking about how to organise this content is usually based on your needs and intentions.
The classification model is a way of representing information by hierarchising it, i.e. organising it according to a logical order or structure. The links between the different parts are made by inclusion, i.e. by identifying the elements that are included in a category or set, and the pyramid of levels, which will indicate the hierarchy. To achieve this, a grouping by sets, classes or categories is done according to characteristics that you will have established (Barbeau et al. 1997).
This model cannot be applied to all types of information, it is normally used for a type of text where a classification and hierarchisation is needed to have an overview and understand the structure of a discipline, a theme, etc. For example, this model can be used when you need to situate one or more elements within a whole: the theories or currents of thought related to a discipline, the disciplines in a program or curriculum, a course related to a path within a program, etc.
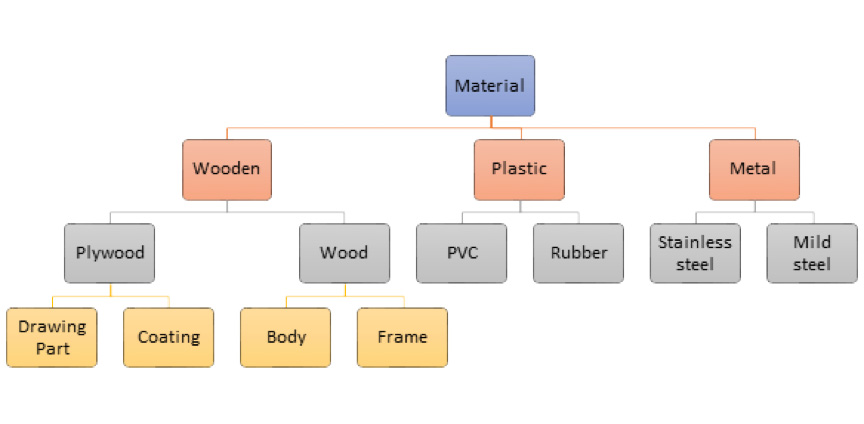
Example on the classification of material:
Sources :
Md. Maksudul Islam, Lipon Kumar Sarkar, Md. Sajibul Alam Bhuyan, Sayed Shafayat Hossain American Journal of Industrial Engineering. 2015, 3(1), 6-15 doi:10.12691/ajie-3-1-2. http://pubs.sciepub.com/ajie/3/1/2/figure/7
Advantages
Reduce the feeling of confusion when faced with a large amount of information.
Locate information more quickly when needed.
To get started
Answers developed from the following example:
Questions to ask yourself :
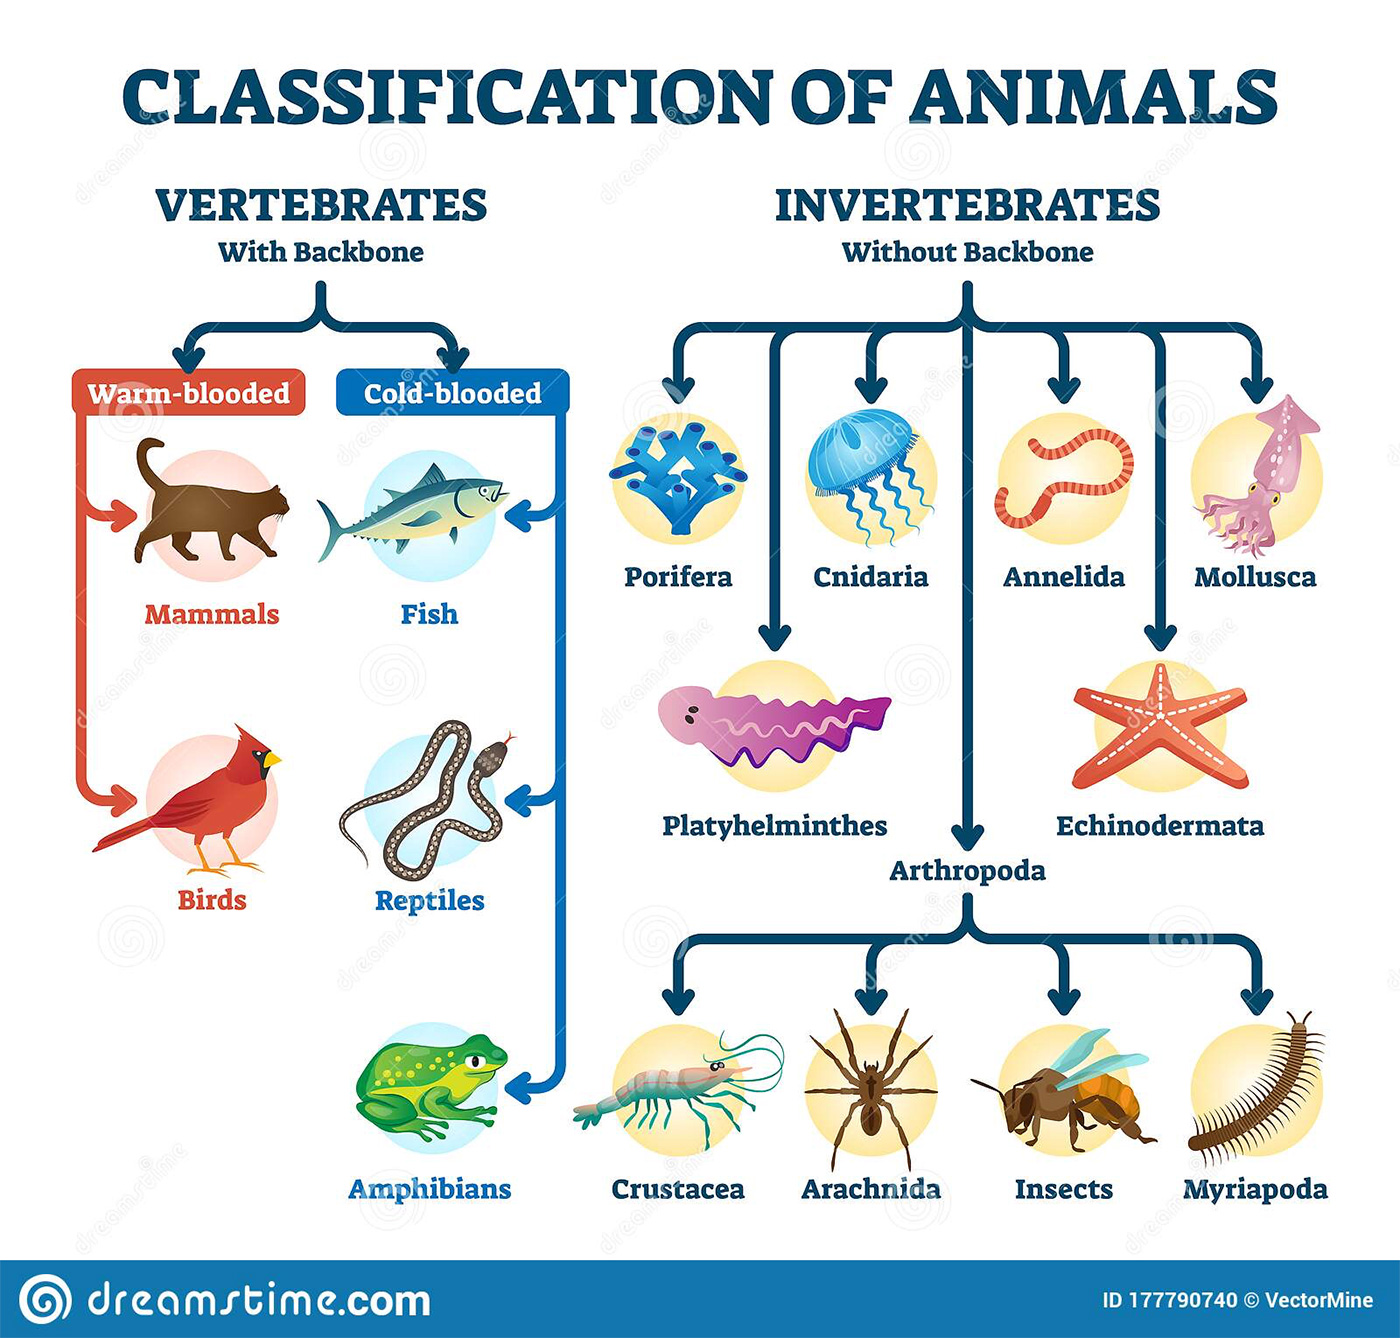
- What is the most general category? (e.g. the animal world)
- Which categories are subordinate to it, i.e. the categories that follow from it? (e.g. vertebrates, invertebrates)
- Identify the categories that follow from these new categories and so on. (e.g. vertebrates: mammals, birds, fish, etc.)
- How many levels are there to deal with?
The only way to develop this skill is to repeat it as often as possible.
Exercise:
- Choose a text to read as part of a course for the present session;
- Identify pieces of information that can be represented according to the classification model;
- Represent them.
Comparing
Comparison is defined as "examining the similarities or differences between data from two or more sources". (Translated from the Office québécois de la langue française, 2012).
According to Ruph (2010), comparing allows much more information to be gained from observing items rather than examining them separately, even if this is done accurately and completely. The use of the comparative model consists of organising, in tabular form, items of information according to their similarities (resemblances) and differences (Barbeau et al. 1997). Elements (ideas, facts, concepts, theories, approaches, solutions, people, etc.) are compared with each other, with a view to distinguishing data that are similar at first sight, thus reducing the risk of confusion and grouping together aspects that have commonalities: "An effective comparison is done part by part, element by element" (Ruph, 2010: 48).
Advantages
Making comparative tables helps to visualise similarities and differences between concepts, theories, etc. It facilitates encoding in long-term memory and recall of information at the appropriate time.
It avoids confusing apparently similar concepts; makes it easier to classify by set and sub-sets.
To get started
Questions to ask yourself :
- What is being compared?
- What are the similarities between X and Y?
- What are the differences between X and Y?
- What are the attributes of ...?
The only way to develop this skill is to repeat it as often as possible.
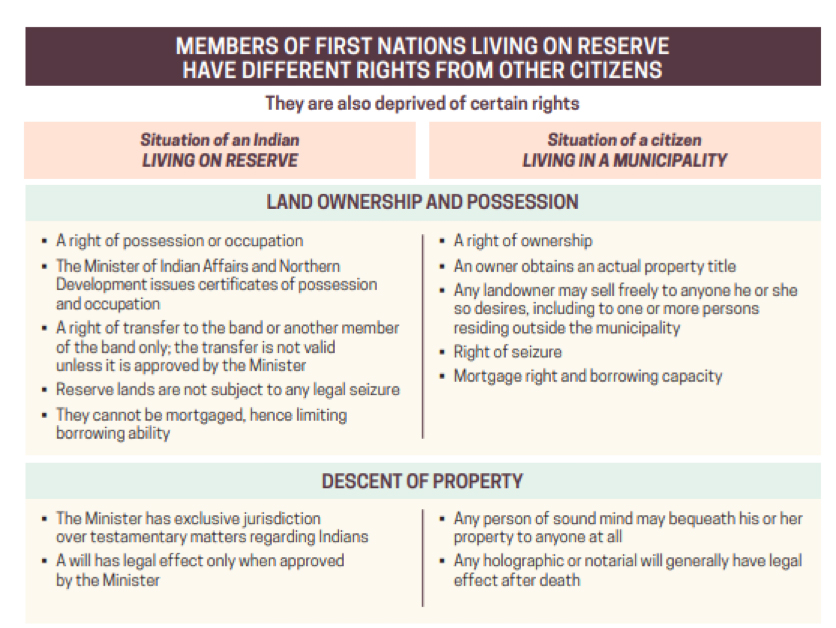
Example of a comparative table:
(from Lepage, 2019, p.46)
Source :
Lepage, Pierre. (2019). Aboriginal Peoples – Fact and Fiction", 3rd edition. Commission des droits de la personne et des droits de la jeunesse; Institut Tshakapesh.
Exercise :
- Choose a text to read as part of a course in the current session;
- Identify pieces of information that can be represented according to the comparative model;
- Represent it (using two columns).
Representing the information using a conceptual map
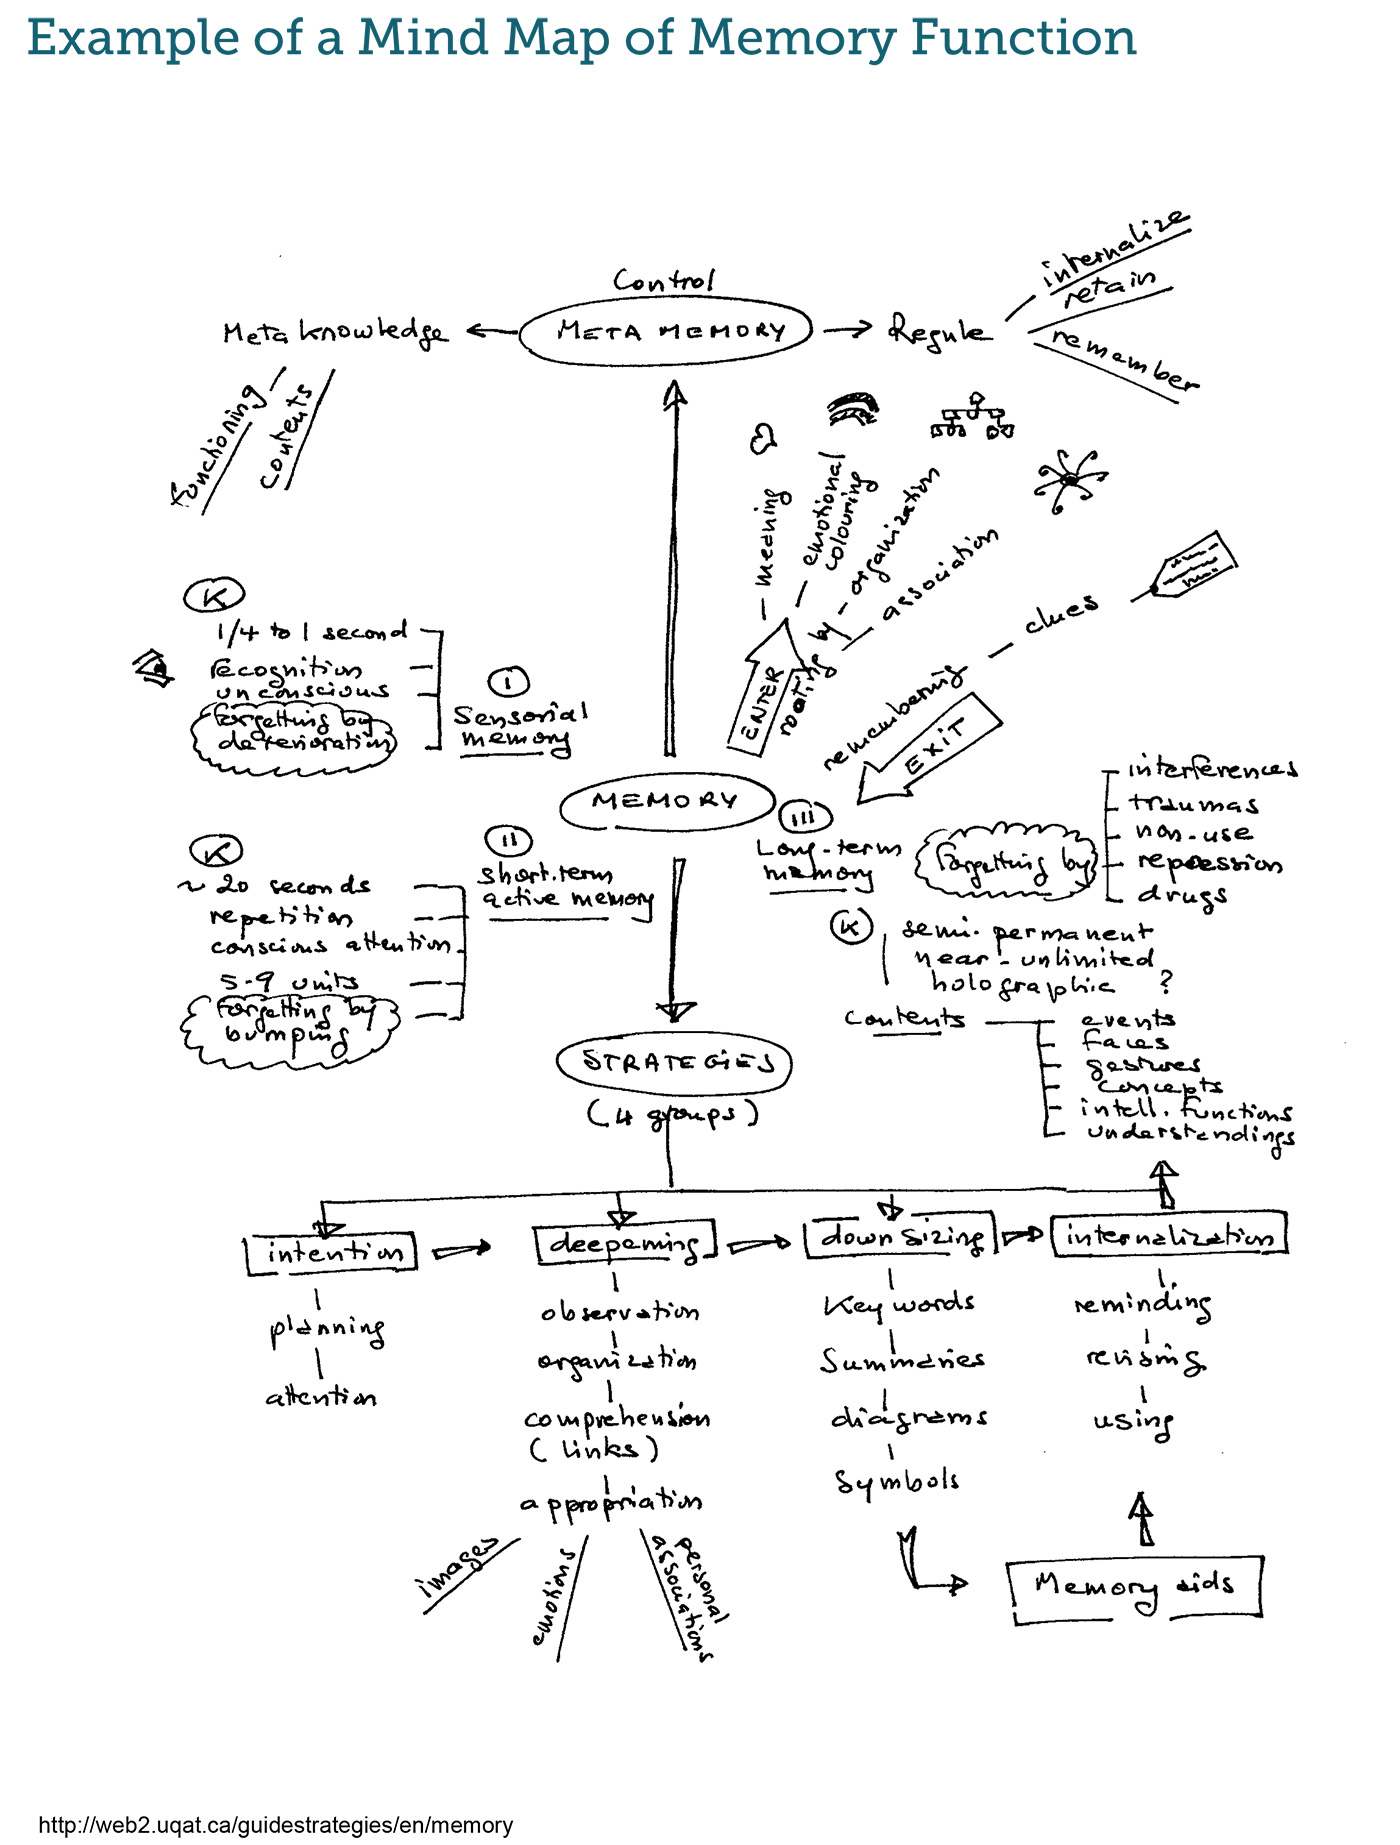
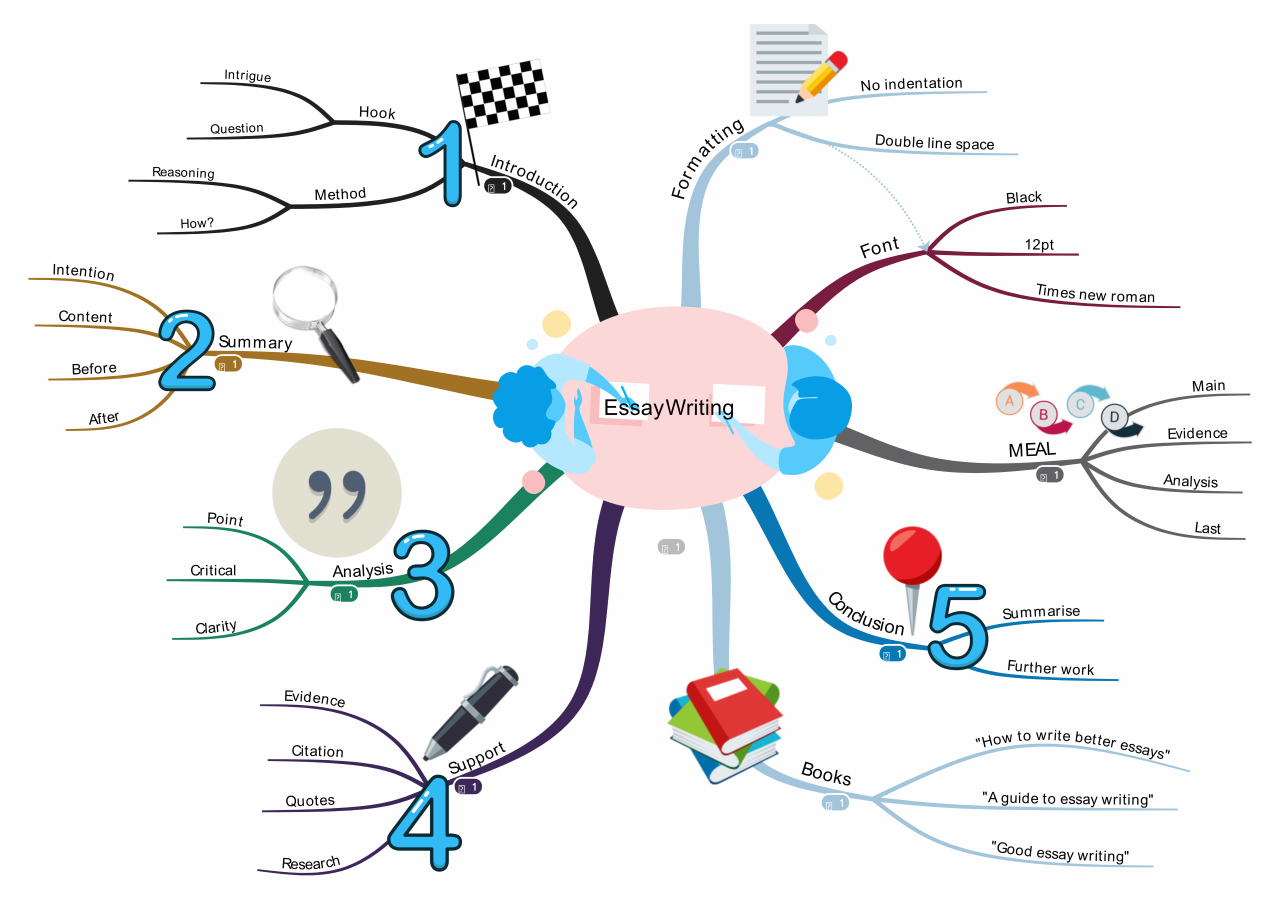
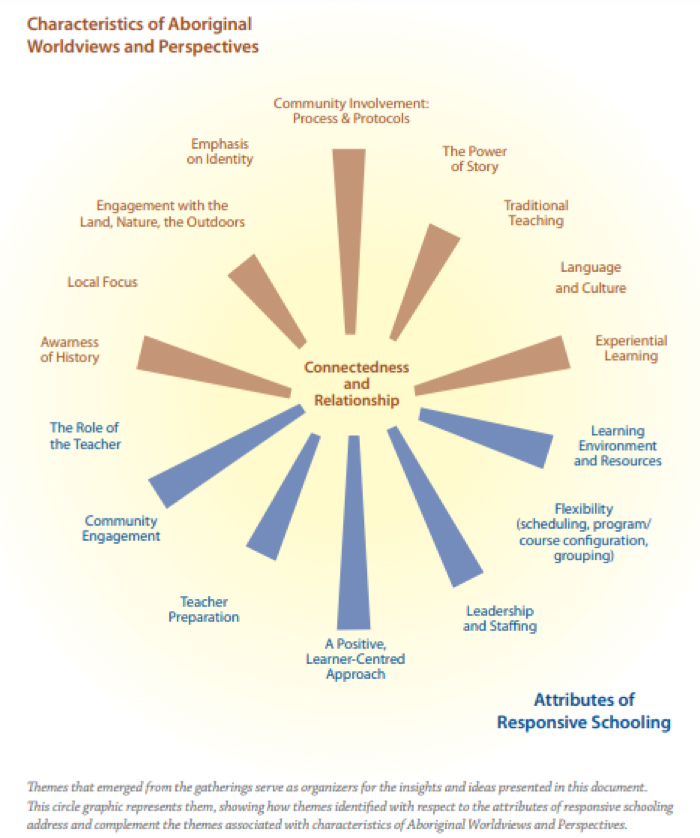
Concept mapping is defined as "a representation of concepts... in the form of a map that graphically illustrates the links between ideas, so as to facilitate visualization of the whole" (translated from: Office québécois de la langue française, 2001). This model proposes an organization of information according to the hierarchical or semantic links that exist between the elements. It represents the form of a text or a presentation, and illustrates its organisation. Other terms are also used to designate a conceptual map: cognitive map, mind map, concept network, tree diagram, semantic network, etc. (Lamy, 2008; Mottet, 2008).
Generally speaking, a conceptual map represents the key words of a text, knowledge or discipline that one is trying to summarise. Precise links must be established between the concepts connected by a verb or an adverb, taking into account the hierarchy existing between these concepts, if applicable, or other types of associations or relations between ideas, such as sequences or a branched organisation around different key concepts (Buzan, 2012). Conceptual maps can take many forms: they can sometimes look like flow charts, or they can take looser forms when they are organised around a main idea at the centre of the page, and then the different concepts are branched out around this central theme. The concept map encourages students to go beyond definitions by allowing them to reinvest their personal knowledge to better understand a text (Zwiers, 2008)
Advantages
Concept maps help students make connections between concepts and also improve their understanding of texts. They support learning in a variety of content areas because they help students organise information, encourage them to question and make connections with their prior knowledge (Nist and Holschuh, 2000).
To get started
Questions to ask yourself :
- Which concept is the most general or integrative?
- Are there different levels, are several concepts of equal importance, do the ideas link together?
- What relationships exist between the concepts?
- How can I represent this whole, this unity in the most meaningful way?
Steps
- Identify concepts relevant to understanding the subject matter: read, understand words, sentences. Reread and underline what is important by summarising with a key word;
- Identify the main idea that is the most encompassing;
- Group together concepts that have the same importance;
- Identify supporting or sustaining concepts;
- Establish a hierarchy between concepts, organise them around themes;
- Define the relationships between concepts (using a verb or adverb);
- You can use symbols (e.g. arrows), images, colours (e.g. use the same colour for related concepts).
There are several software programs that can help you build mind maps (e.g. Inspiration 8, I MindMap)
The only way to develop this skill is to repeat it as often as possible. If your concept map is not right the first time, be patient. The more you do, the more meaningful they will become.
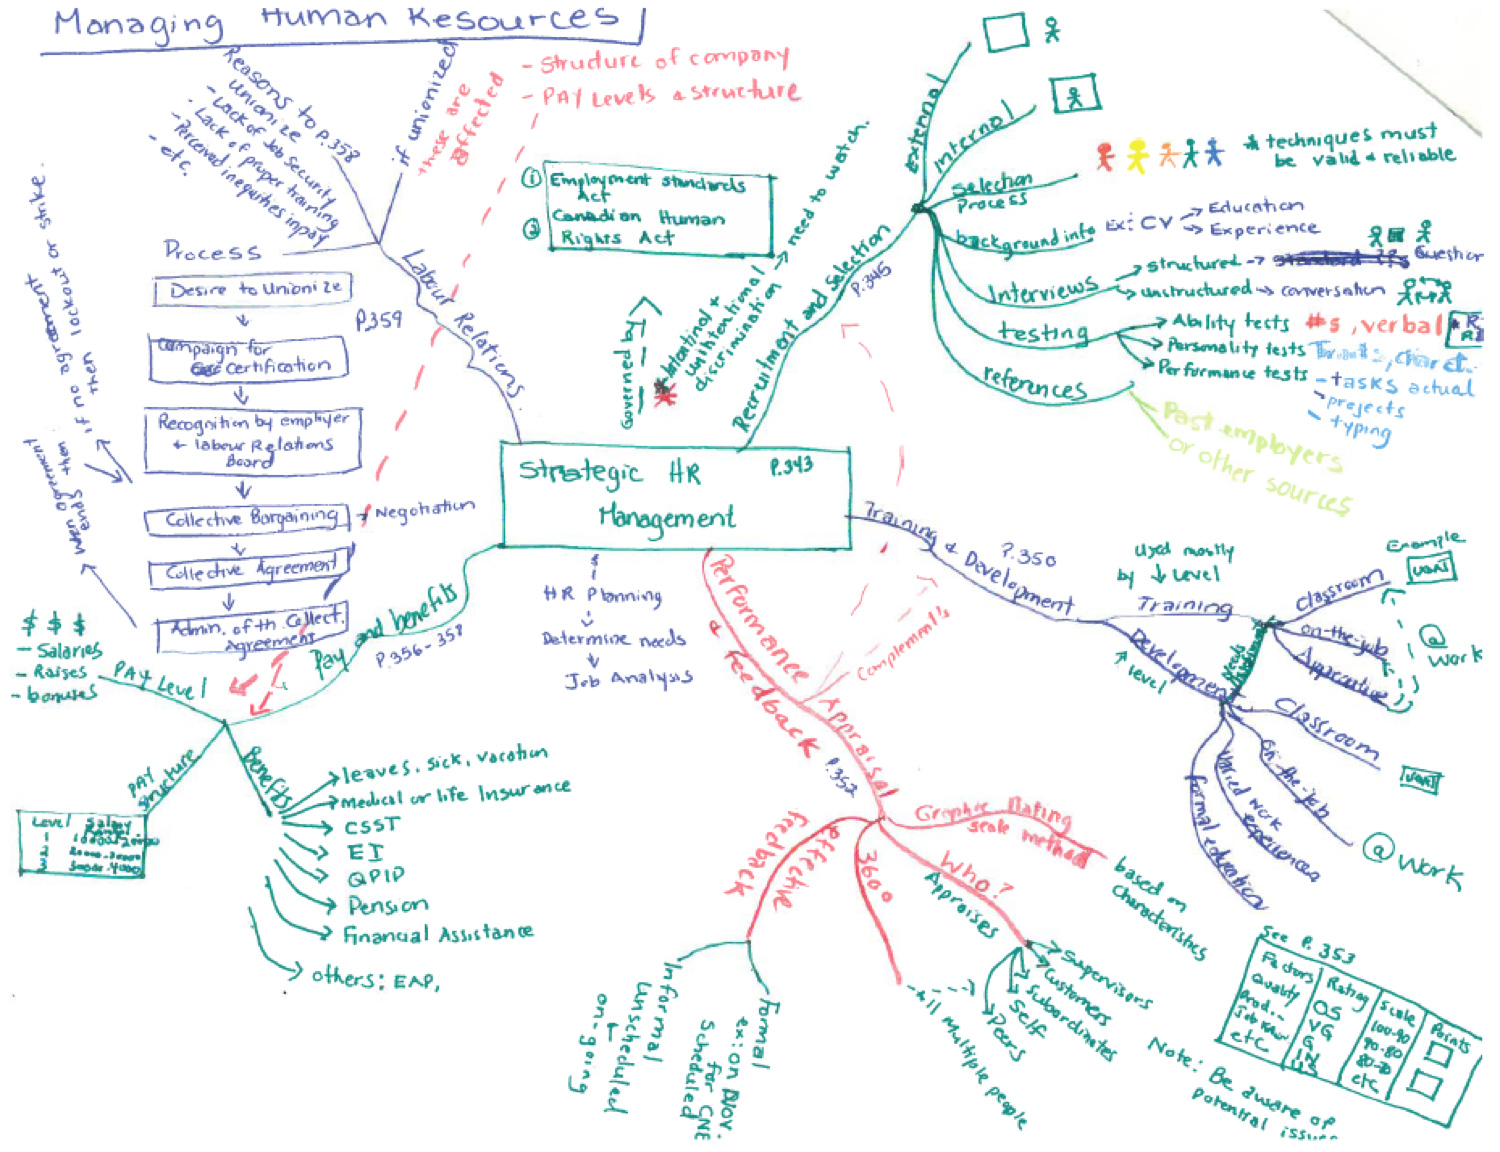
Examples :
On the web you can find hundreds of examples to get inspiration. Use the following keywords:
- Conceptual map
- Map or mind map
- Mental mapping
Source :
Represent your knowledge visually
Organising knowledge consists of creating or applying a memory aid or mnemonic to the construction of charts, diagrams, tables or conceptual maps (Bégin, 2008). Representing one's theoretical knowledge in a visual way therefore consists of integrating several pieces of information into an 'organised whole' in order to perceive the relationships that exist between them (Barbeau et al., 1997).
Visual organisation of knowledge can be used in a variety of situations, for example, to help you visualise the structure of a text: cause and effect relationships, problem-solutions, comparison and contrast, chronology in time and other types of patterns. Visual representations of key concepts often lead you to see these models of text organisation, making their structure more explicit. This encourages you to see how knowledge is structured in a particular field (Nist and Holschuh, 2000).
Visual representation models
Visual representation of information depends on your ability to identify key words, the essential elements of a text or oral presentation. It is therefore important to practise identifying key words in a text or in your course notes and then to see the links between them. Several models can be used: descriptive, causal, argumentative, generalisation, sequential, etc. (Barbeau et al. 1997).
The descriptive model
Sources :
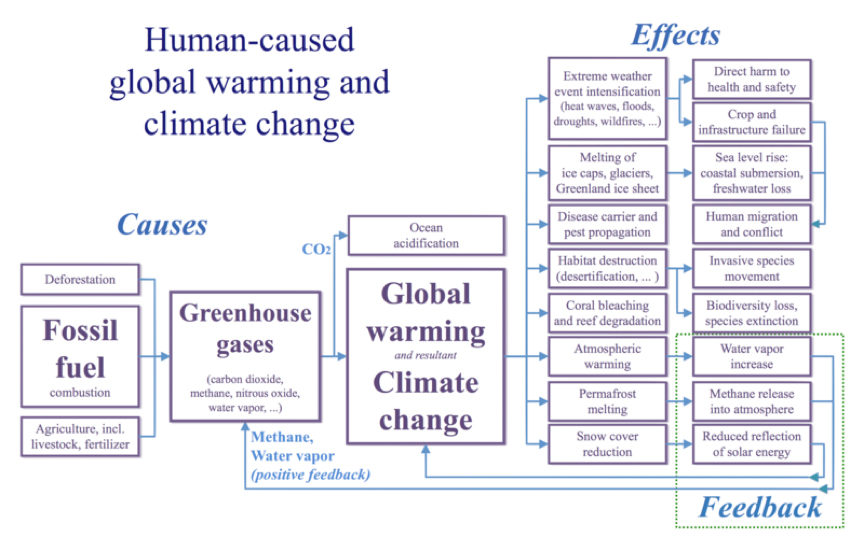
The causal model
The causal modal
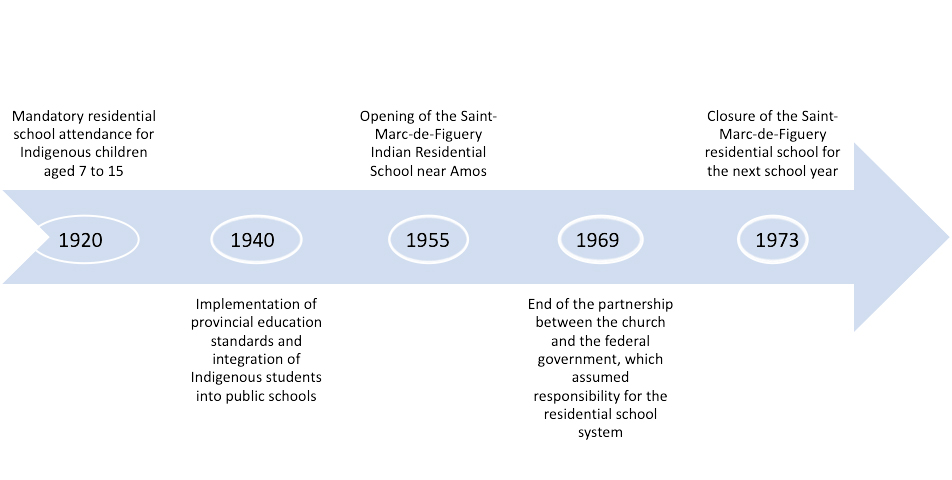
The sequential model
The chronological model
Sources :
Legacy of Hope Foundation. (2014). 100 Years of Loss: The Residential School System in Canada. Consulted on https://legacyofhope.ca/generations-lost/gl-timeline/
Unknown author. (1973, avril). Le pensionnat indien ferme. L’Écho, p. A‑3.
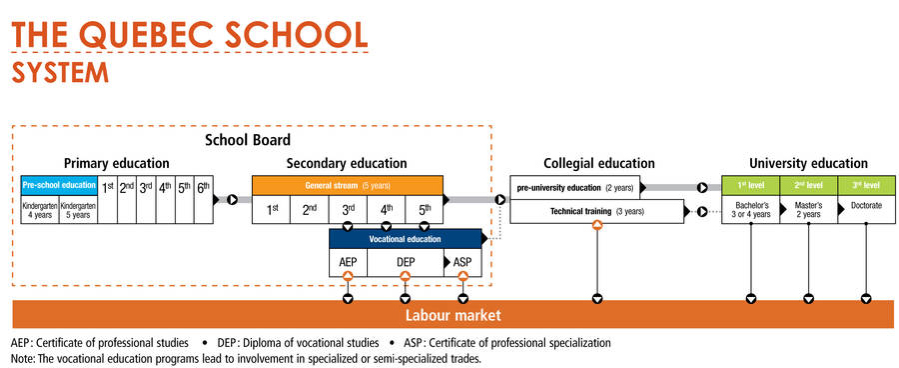
The sequential model
Sources :
Diagram taken from: Quebec Education System. Consulted on https://www.quebec.ca/en/education/study-quebec/education-system
The generalisation model
Allows you to organise pieces of information around a more general notion that encompasses them (e.g. Russian dolls). By identifying the general class, it allows the examples related to each category to be included afterwards. This mode of representation makes it possible either to explain an idea or to develop the initial steps of a classification.
Advantages
Representing knowledge visually makes it easier to understand pieces of information by establishing relationships between ideas.
This practice increases the working memory capacity when reading by grouping details into sets.
It facilitates the creation of analogies or comparisons.
It serves as a tool for structuring and storing in your memory the information extracted from the readings.
It increases the reader's degree of engagement with the text, as well as interest and pleasure in reading (Giasson, 1990).
Sources :
Source : Human-caused global warming and climate change. Consulted on : https://commons.wikimedia.org/wiki/File:20200101_Global_warming_-_climate_change_-_causes_effects_feedback.png
To get started
For each of the methods for graphically representing information, it is important to take time to elaborate and organise the information to be processed.
Exercise
To integrate each of these modes of representation:
- Choose a text to read as part of a course for this session;
- Identify elements of information that can be represented in the model you need;
- Represent it.
Descriptive
- What are the functions or attributes of…?
Causal
- What are the causes of…?
- What has caused…?
Argumentative
- What thesis is being defended?
- What are the premises?
- Are these premises linked or independent?
Sequential
- What is the initial state?
- What are the intermediate states?
- What is the final state?
Generalization
- What are the examples of...?
- What illustrates...?
